
Earlier this week, we released the mid-year update to the 2020 Vulnerability and Threat Trends Report offering insight into the current cybersecurity landscape. One of its key findings is that the number of new vulnerability reports this year is likely to exceed 20,000. Considering that the previous high reported last year was just over 17,000 vulnerabilities, this is a significant uptick and is indicative of just how complex cybersecurity management, and by extension vulnerability management, has become.
But how did we arrive at this record-breaking figure?
Over the years at the Skybox Research Lab, we have honed the methodology that we use to determine vulnerability counts to give you the most accurate picture of the current state of play. It is this methodology that enables us to extrapolate forward from previous years’ trends and gain insight into how many vulnerabilities we are likely to see in the coming months.
How We Determine Vulnerability Counts
We use CVE IDs (NVD) to determine vulnerability counts. These IDs are reserved in bulk each year for self-reporting by the Numbering Authorities (CNAs), which include many brand name companies and third parties that dole them out per-request. This process either happens privately or publicly, meaning that it’s difficult to know for certain how many CVEs are assigned until and unless they are published. CVEs can be reserved but end up unused, or reserved and ultimately rejected. This, invariably, leads to difficulties in determining a real-time picture of how many CVEs exist.
We look at the CVE IDs shared by the National Vulnerability Database (NVD) in each edition of the Vulnerability and Threat Trends Report. Although the NVD’s findings trail those reported by the CNA, for us they represent the gold standard of CVE classification and publication because their reporting more accurately represents vulnerabilities that actually exist. When the NVD shows a CVE that has a given year in its ID, whether that year was initially known publicly or privately, this means that it represents a vulnerability that was first identified in that year. But it does not mean that the vulnerability was public knowledge in the year of its identification.
This system leads to an initial underreporting of vulnerability counts. Understanding the backlog of vulnerabilities and the historic reaffirmation of CVE counts is important when understanding what’s really going on with vulnerabilities on any given date and also when developing predictions about future vulnerability trends.
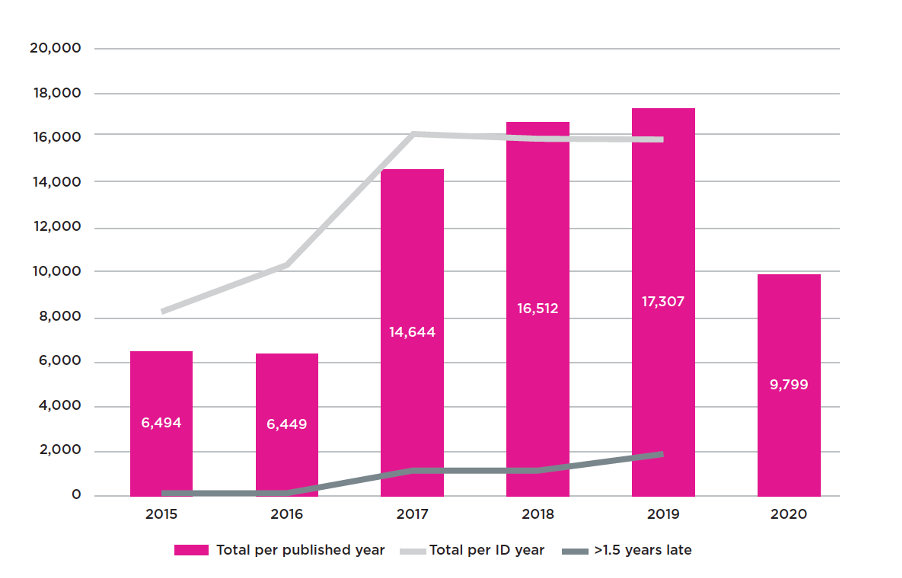
It can be years until the actual number of vulnerabilities published on any given year is known. This is shown in the graph with the split between the ‘total per published year’ and ‘total per ID year’ values. The pink bars show the total number of vulnerabilities known during the year that they were published, and the light grey line shows the reality of vulnerability counts as are currently known.
The work being conducted by the NVD to clear their backlog is shown with the dark grey line showing flaws made public ‘>1.5 years late’ – and you will see that the number of historic vulnerabilities that they report is growing every year.
Looking at the ratio between the CVEs ‘per ID year’ and those made public ‘>1.5 years late’, we have been able to determine that over 3,000 vulnerabilities that have made their presence felt this year have also been relevant to problems that were extant and identified last year.
There are Going to be 1,000 Hidden Vulnerabilities in 2020
We use CVE IDs from the National Vulnerability Database to determine vulnerability counts. These IDs are reserved in bulk each year for self-reporting by the CVE Numbering Authorities (CNAs), which include many brand-name companies and third parties that dole them out per request. This process either happens privately or publicly, meaning that it’s difficult to know for certain how many CVEs are assigned until and unless they are published. So CVEs can be reserved but end up unused, or reserved and ultimately rejected. This, invariably, leads to difficulties in determining a real-time picture of how many CVEs exist.
We look at the CVE IDs shared by the National Vulnerability Database (NVD) in each edition of the Vulnerability and Threat Trends Report. Although the NVD’s findings trail those reported by the CNA, for us they represent the gold standard of CVE classification and publication because their reporting more accurately represents vulnerabilities that actually exist. When the NVD shows a CVE that has a given year in its ID, whether that year was initially known publicly or privately, this means that it represents a vulnerability that was first identified in that year. But it does not mean that the vulnerability was public knowledge in the year of its identification.
This system leads to an initial underreporting of vulnerability counts. Understanding the backlog of vulnerabilities and the historic reaffirmation of CVE counts is important when understanding what’s really going on with vulnerabilities on any given date and also when developing predictions about future vulnerability trends.